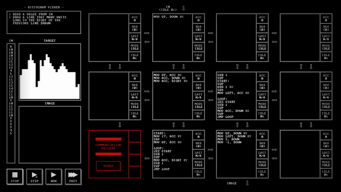
There’s no quick way to draw vertical lines, so the drawing unit here just takes the coordinates of a point and draws a pixel there, and the units above and left of it decompose a vertical line into points and feed the values to it. The X unit sends down the same value for every pixel and increases its coordinate when it receives the data for a new line, and the Y unit starts at 17 (the index of the bottom row) and decreases its value by 1 for every pixel in the line.
Links
Meta
Categories
Archives
